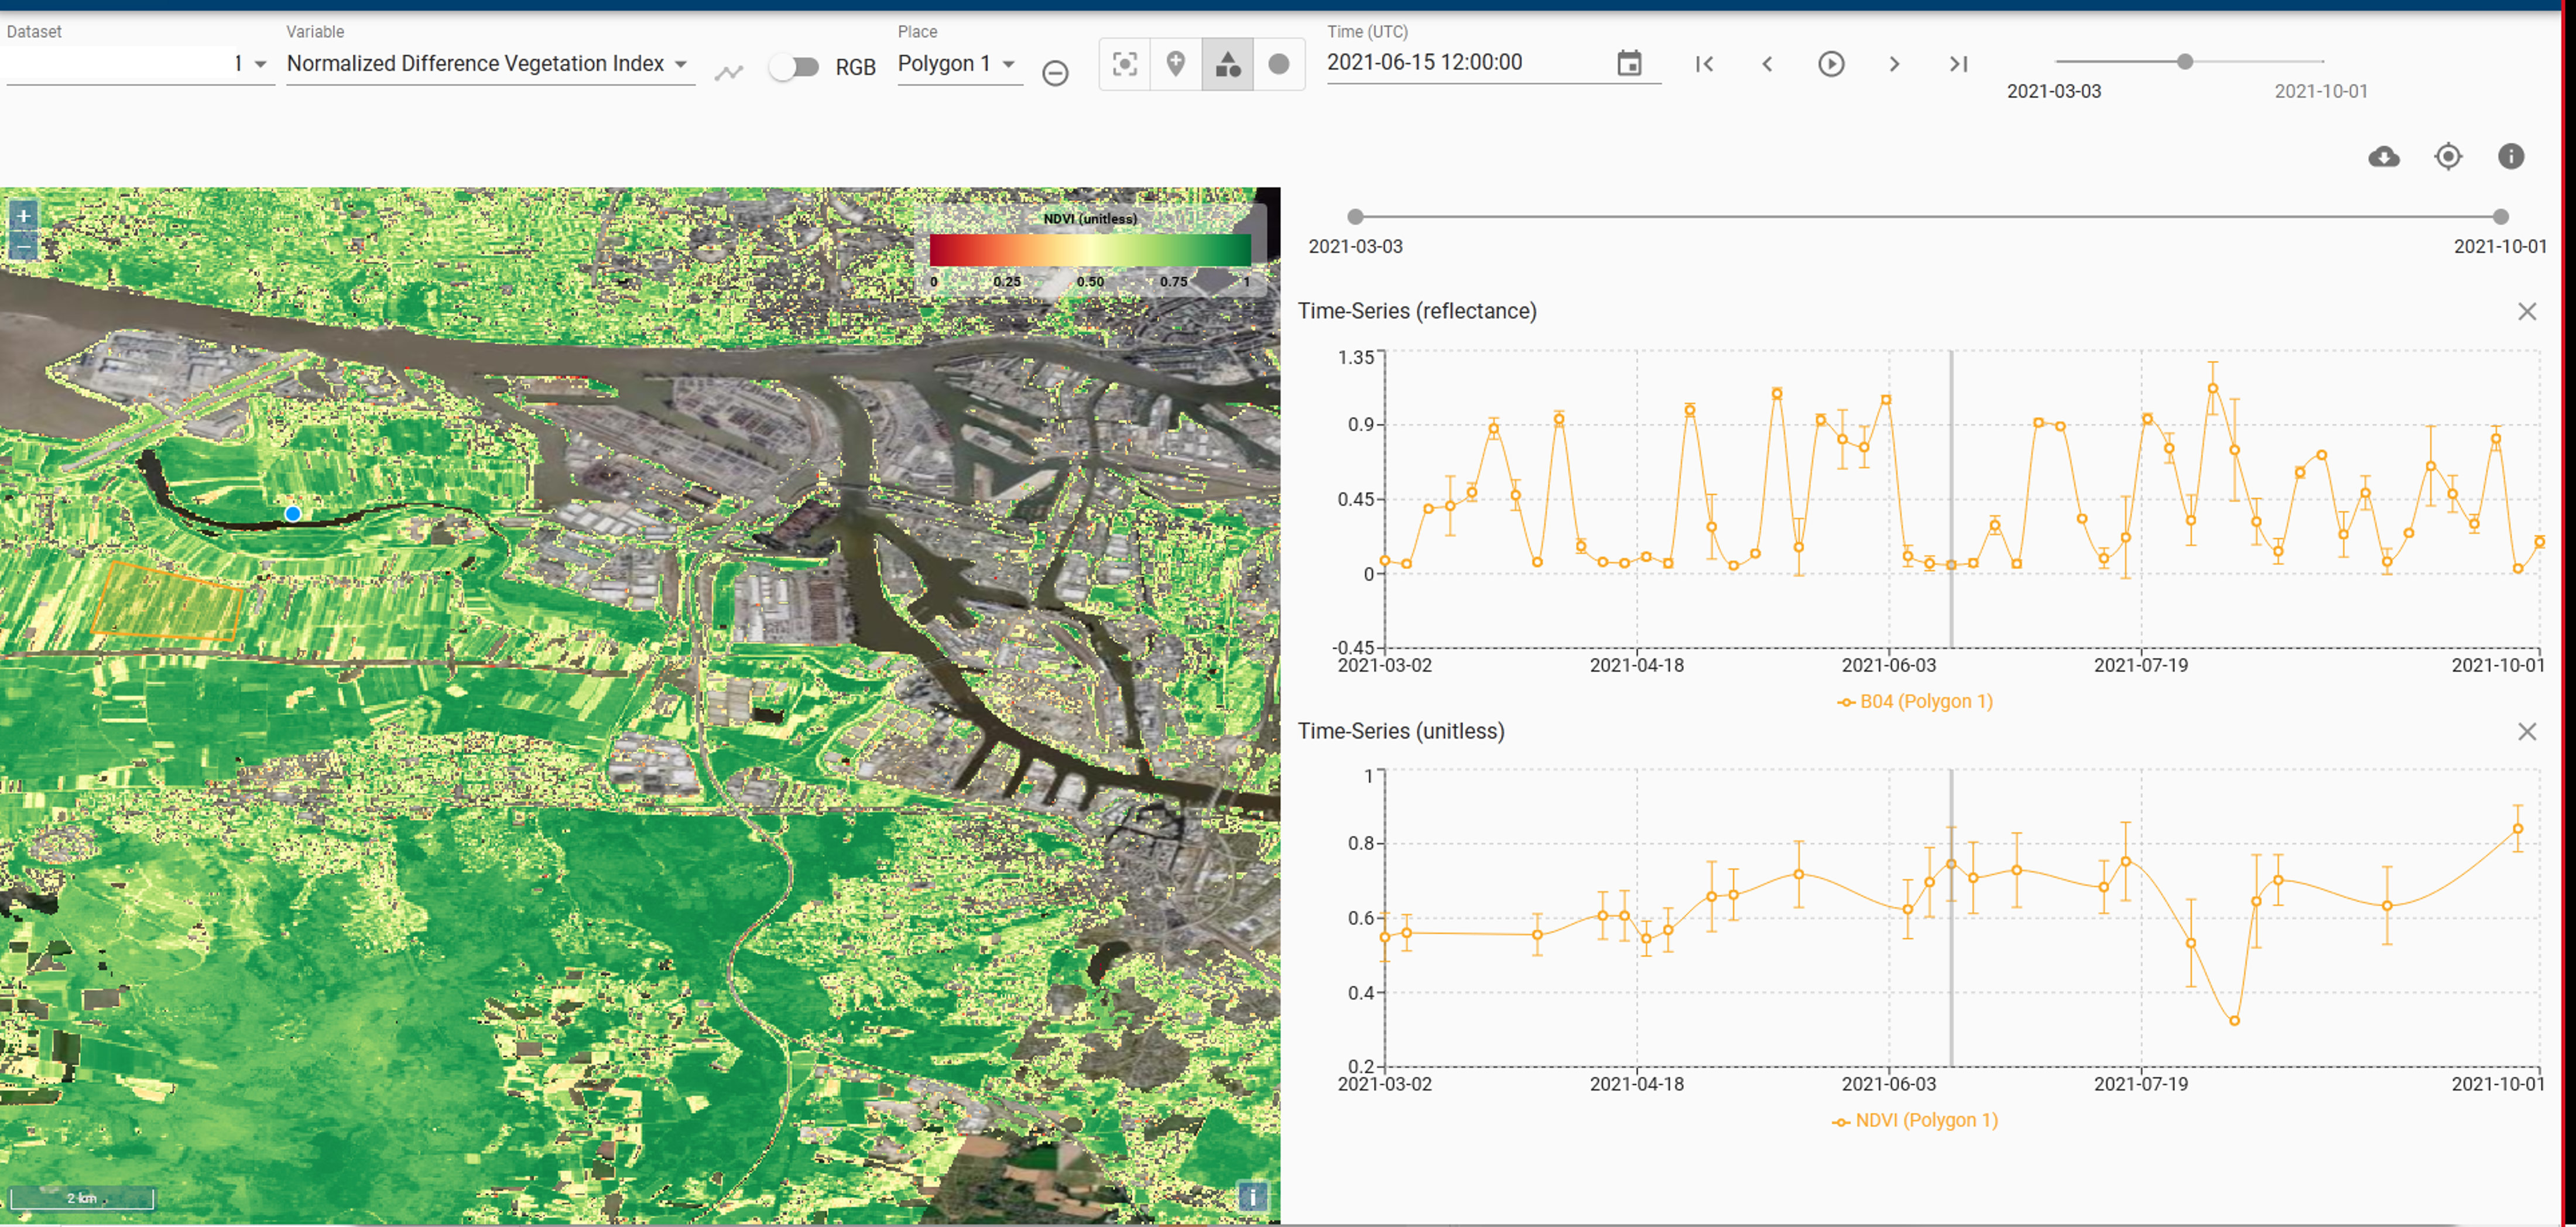
The AVL Cube Viewer App is a simple and intuitive web application that is used to browse and visualize the AVL data cubes. It also provides basic time series analyses. Multiple time series can be easily generated for points or areas and visualised side-by-side. Points and areas may be user defined or come from a configured places library (vector data source). 

In a nutshell

Browse available data cubes,

Display detailed data cube information,

Select cube variable and display it on the map,

Change variable colour mapping (colour bars and value range),

Browse associated place groups and places,

Draw user defined places such as points, circles, polygons,

Select place group and draw it on the map,

Select place and generate time series,

Display multiple time-series plots side by side.